The article was published first at the Urban shading in Israel Exhibition book (For more details book click here).
Currently over 50% of the world’s population are city dwellers. Projections for the foreseeablefuture predict that, by the year 2030, two thirds of the world’s population will live in cities. In Israel 85% of the population is located in urban settlements. Urbanization will predominate overhumanity’s settlement patterns with all its implications. More than ever before, we are now aware how city form impacts the quality of life of its inhabitants and how it affects the environment.
Natural land-cover is being replaced by distinctly urban surfaces, which affect the energy balance of the city,(1) creating a local condition known as urban climate.(2) The urban climate has a significant impact on the lives of the city’s inhabitants, including their physical and mental well-being indoors and outdoors (3). Air temperature, for example, has a decisive effect on the thermal comfort of human beings, particularly in arid lands where summer shading and passive winter heating is beneficial. Thermal comfort furthermore, affects the energy people use for cooling and heating, their use of public transportation and their outdoor activities. A thermally uncomfortable outdoor space is destined to turn into a barely used dysfunctional space, causing people to spend more time indoors, while increasing the unsustainable use of energy to acclimatize indoor spaces. Making cities a more pleasant environment to live in, in terms of their local climatic conditions, will therefore significantly enhance the quality of life and health of their inhabitants. Existing studies consider solar radiation as one of the key factors in determining a city’s urban climate (4). The morphology of the urban environment, which consists of the geometry of urban features, such as buildings and trees and their spatial distribution, has a major influence on solar access. Availability of natural daylight or the obstruction of light and theoptimal exposure to solar radiation are all affected by the form and organization of urban features. The importance of selective solar exposure in streets and buildings is well-documented (5). It determines whether an open space or a street is shaded in summer or exposed to the sun during winter. Understanding shadow patterns in the urban environment and the effect of shadow casting elements is essential for achieving climatic conscious planning and design, by the optimal spatial arrangement of buildings, vegetation and open spaces.
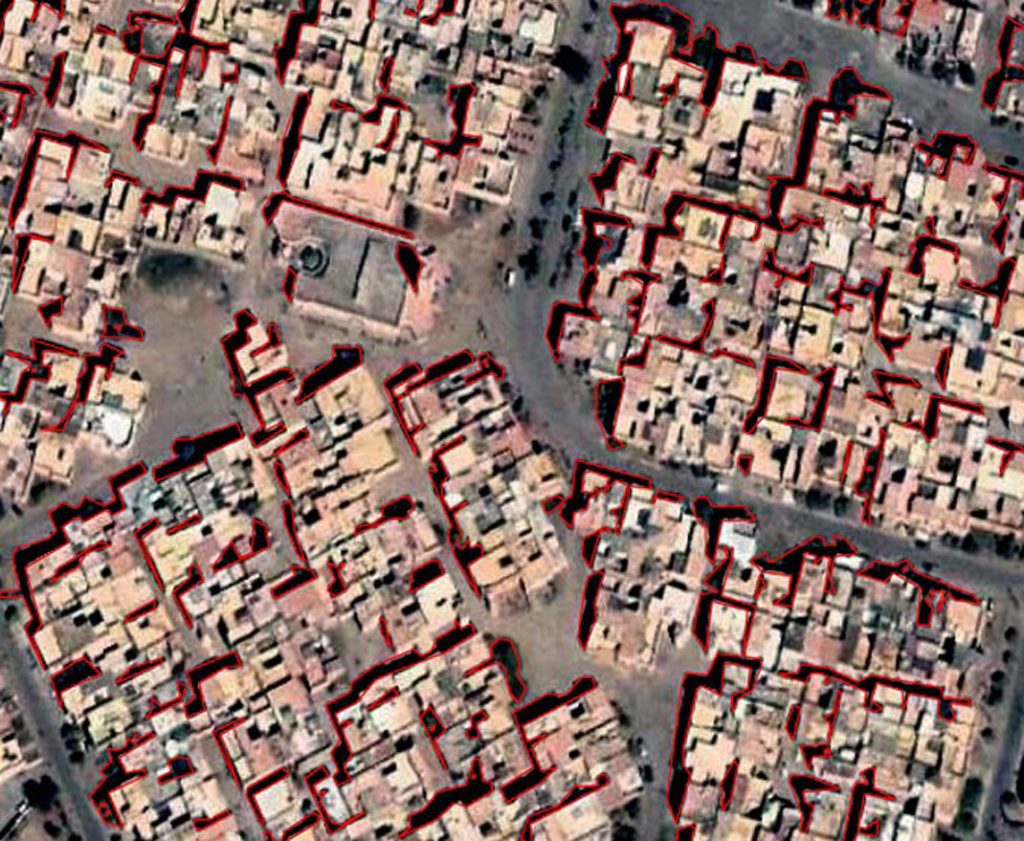
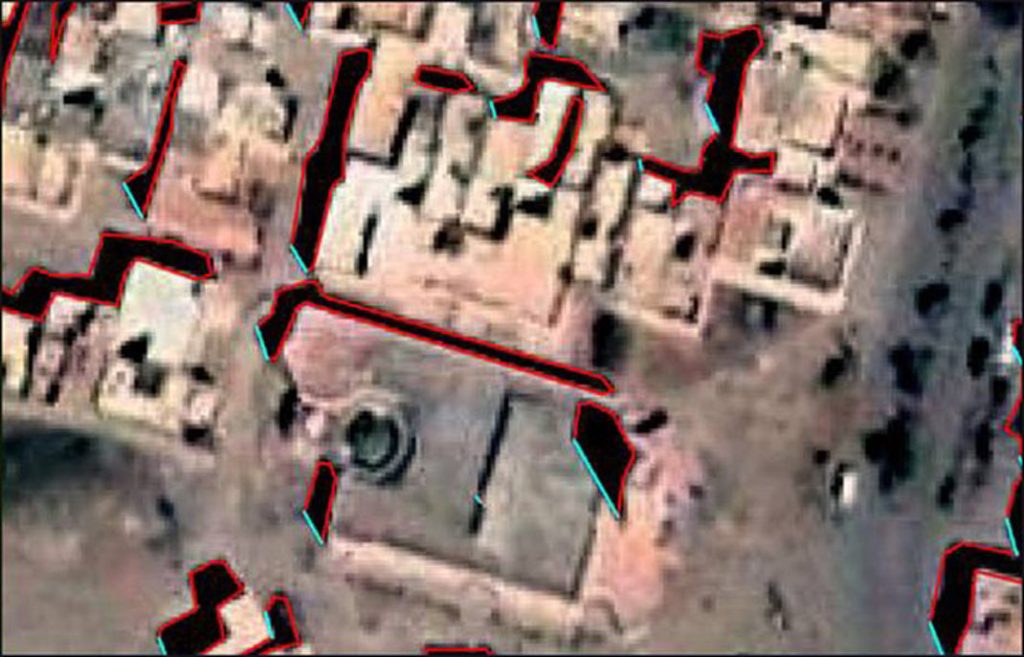
Analysis of urban shadow patterns can be based on simulations of 3D urban forms or by modelling shadows cast by different urban features and geometries. A pre-requisite, to simulate the 3D morphology of urban forms, is the presence of 3D data that includes the height of urban features. One option for constructing these 3D databases (especially in cases where no accurate survey datais available) is to use remotely-sensed data, such as satellite and aerial images. Urban features and shadows, cast by these features, can be extracted from the images using automated objectrecognition techniques. The high temporal and spatial resolution of space and airborne data offers an up-to-date representation of the urban environment. Yet, a major concern in the automated recognition of urban objects from 2D images is that, in most cases, output results with 2D footprints of urban features without the essential height information. One solution is to use cast shadows, and particularly the length of the shadows in the image, to extract 3D information. The height of the objects can be calculated based on existing algorithms, the sun’s position (i.e. the accurate date and time of the image acquisition and the geographical latitude), and topographical slope. A variety of methods has been developed to recognize and segment shadowed areas from an image (6). Fig 1 illustrates the output of a recognition system developed by Peeters and Etzion (2012) in which recognition is based on readily available, open-source imagery, such as Google EarthTM. Output is used for extracting the length of cast shadows for modelling urban 3D morphology (Fig 2).
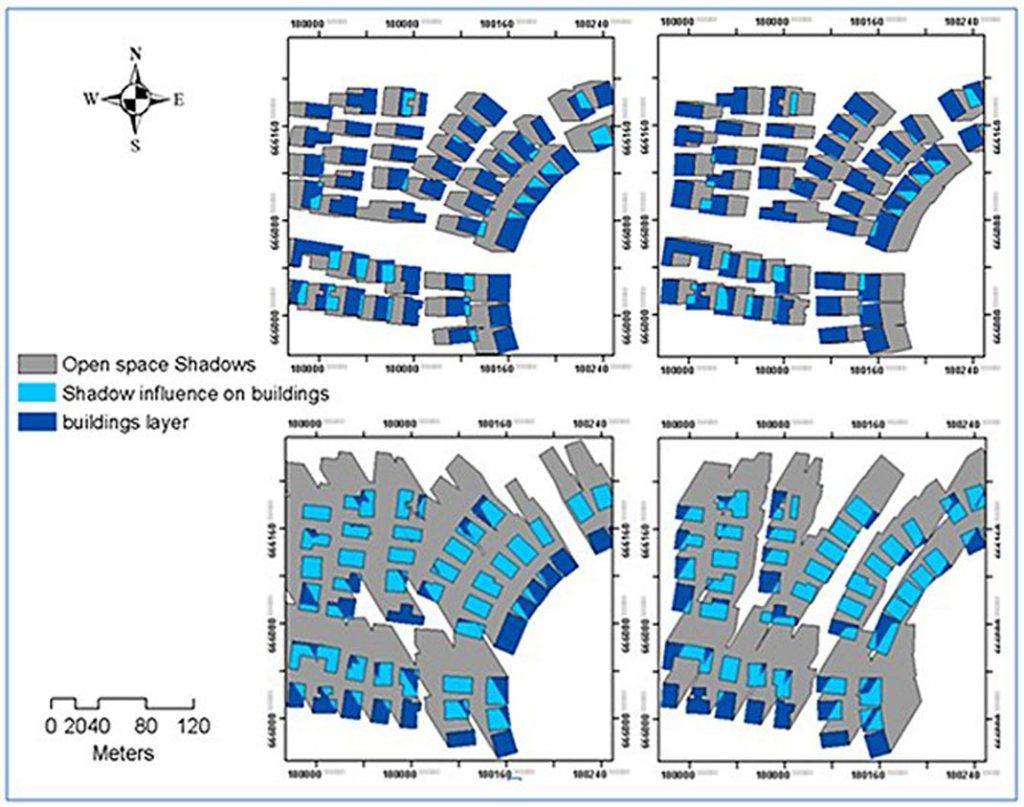
Reconstructed urban 3D morphology and 3D models of proposed urban plans, can be used to model shadow patterns at different geographical locations and at different times of the year. Evaluation of the proposed urban plans is as important as the orientation of wall facets and their glazed openings, in relation to the sun. This is a major concern in designing indoor and outdoor spaces which will be thermally comfortable. Exposure of the building walls to the sun, has to be taken into consideration at the planning stage, when designing window elements and shading devices. Fig 3 presents the outputs of an automated system for computing shadows cast by buildings at the urban scale and at different geographical locations. The system is based on the building’s location relative to the position of the sun at a given point in time (7).
Such systems for analyzing and modelling urban shadow patterns can support: detecting areas exposed to direct solar radiation for climate-conscious open space planning and integration of climatic considerations in city zoning, calculating shadow maps and analyzing solar exposure of urban vegetation to optimize landscape planning in open spaces and detecting solar access for building integrated solar photovoltaics and thermal solar collectors on roofs. Understanding urban shadow patterns cast by urban features, is therefore essential for developing sustainable planning and policy-driven solutions, that will significantly enhance the well-being and quality of human lifein urban environments.
1.
Grimmond, C. S. B. 1 and C. Souch (1994), Surface description for urban climate studies: A GIS based methodology, Geocarto International 9: 47-59
2.
Oke, T. R. (1987), Boundary Layer Climates, London, Routledge, Taylor and Francis Group
3.
Nikolopoulou, M., N. Baker and K. Steemers (2001), Thermal comfort in outdoor urban spaces: understanding the human parameter, Solar Energy 70(3): 227-235
4.
Szokolay, S. V. (1996), Solar Geometry, PLEA Design Tools and Techniques, Queensland, PLEA: Passive and Low Energy Architecture International
5.
Knowles, R. L. 5 (1981), Sun Rhythm Form, Cambridge, MA, The MIT Press
6.
Irvin, R. B. and D. M. McKeown (1989), Methods for exploiting the relationship between buildings and their shadows in aerial imagery, IEEE Transactions on Systems, Man and Cybernetics 19 (6): 1564-1575Al-Najdawi, N. Bez, H.E. Singhai, J. and Edirisinghe, E.A. (2012), A survey of cast shadow detection algorithms, Pattern Recognition Letters 33:6:752-764 Adeline, K.R.M. Chen, M. Briottet, X. Pang, S.K. and Paparoditis, N. (2013), Shadow detection in very high spatial resolution aerial images: A comparative study, ISPRS Journal of Photogrammetry and Remote Sensing 80:0:21-38
7.
iImage: ©2008 DigitalGlobe ©2008 Europa Technologies ©2008 Google
8.
Weisthal, M. (2014) Assessment of potential energy savings in Israel through climate-aware residential building design, Master Thesis, Ben-Gurion University of the Negev, Be’er- Sheva